Power BI Revit plugin
How to use Power BI Export in Kobi Toolkit for Revit?
In this article, we will demonstrate a few examples of how you can use the Power BI Export tool to visualize your Revit data. The Power BI Export tool is a part of Kobi Toolkit for Revit, which includes over 40 productivity tools. Developed to meet customer needs, Kobi Toolkit for Revit aims to extend the capabilities of Revit, making your work faster and more efficient.

What is Power BI Export?
Power BI is a data visualization platform developed by Microsoft. It allows you to unify data from many sources to create interactive, immersive dashboards and reports that help you gain deeper data insight into your project.
With the Power BI Export tool, which is part of the Kobi toolkit for Revit, you can now use Revit data for creating tables, graphs and visual representations of your BIM model. Once exported, it allows you to efficiently review and manipulate the data without needing to open the Revit file. Perfect for meetings, creating reports or quick reviews.
Power BI Export and how does it work?
Export Revit Model to Power BI
Power BI Export is a new tool added to the Kobi toolkit for Revit that allows you to export and analyse data based on your selection, an active view or the entire model.
Click on the Kobi Toolkit tab  Go to Analysis Panel Select Power BI Export tool

- Selection:
You can use Power BI Export in any view. Choose where you want to select data from (Selection, Active View, Model).
- Strip units: Exports dimensions without units (recommended for working with Power BI).
- Export 3D Mesh: Exports 3D mesh geometry (if the geometry is too complex, it will export bounding box)
- LOD (Level of Detail): Select level of detail in values from 100 to 500.
- Selection:
Select families and elements you want to export by checking boxes in front of the elements use toolbar to:
![]()
> Select all nodes
> Deselect all nodes
> Invert checked nodes
> Collapse all nodes
> Expand all nodes
Visual – opens a folder location of Kobi Power BI visuals (2D and 3D). Copy the path (Example: C:\ProgramData\KobiLabs\Toolkit for Power BI) so you can use it later in Power BI Desktop.
Website – opens KobiLabs website with additional information about the tool.
Select Export and save it as Excel (recommended) or CSV file.

Depending on the exported data type from Revit, select Excel or Text/CSV format and select Connect.


In the left side of Power BI Desktop app is the Visualization panel. Click on three dots (…) and select ‘Import a visual from a file’. Find the location of KobiLabs Power BI Visuals or paste in the path you copied earlier from Revit (Example: C:\ProgramData\KobiLabs\Toolkit for Power BI).
Kobi Toolkit tab Go Analysis Panel Select Power BI Export tool Visual (copy the path of the folder that opens up)

Go to Visualizations Click on … Import a visual from a file Find Kobi KobiLabs Power BI Visuals Open

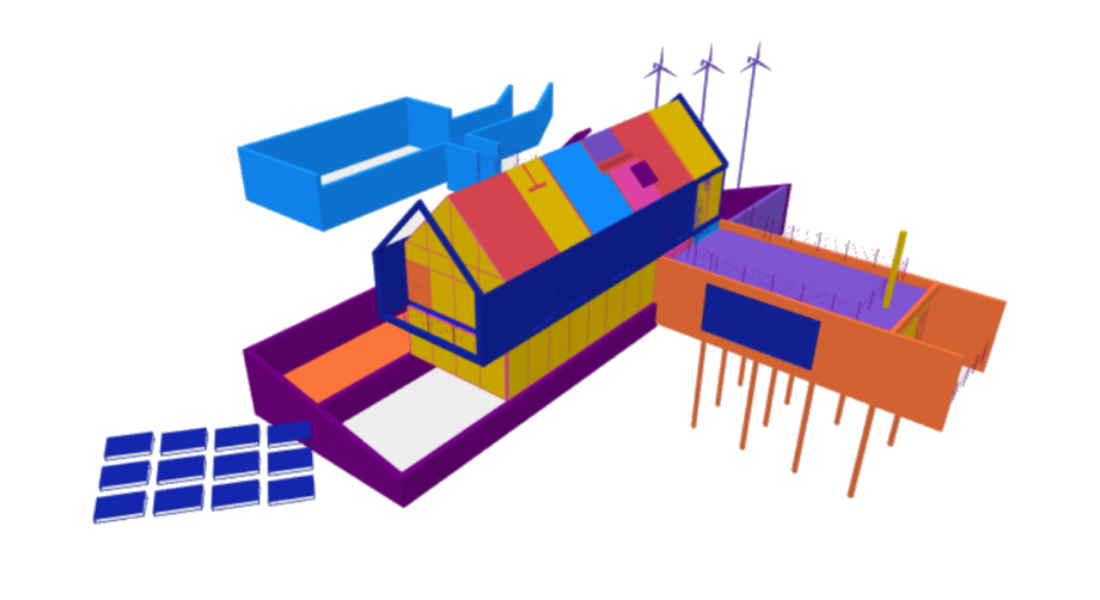
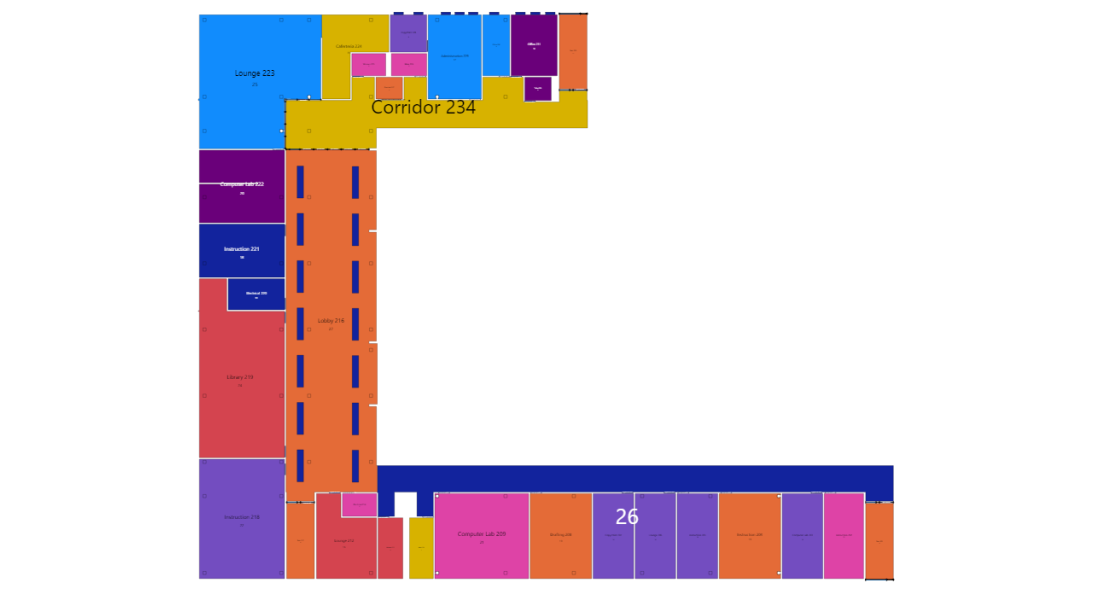
By opening the files (kobi_toolkit_for_powerbi_2d.1.0.21 and kobi_toolkit_for_powerbi_3d.1.0.9) you can now create custom visualizations of Revit data in 2D and 3D.
Visualize your data in 2D  and 3D
Example:
1.) Select 3D visualization ![]() (kobi_toolkit_for_powerbi_3d).
(kobi_toolkit_for_powerbi_3d).
2.) In Fields select the data you want to use, for instance: ID, Name, Area, First Pbi3DGeometry (note: if you are doing a 2D visualization, select First Pbi2DGeometry).
3.) Insert the data by dragging and dropping in selected rows (ID, Caption, Values, Geometry) – Pbi2DGeometry contains geometry for 2D visual and Pbi3DGeometry for 3D visual.


You can change colour combinations under the View tab.

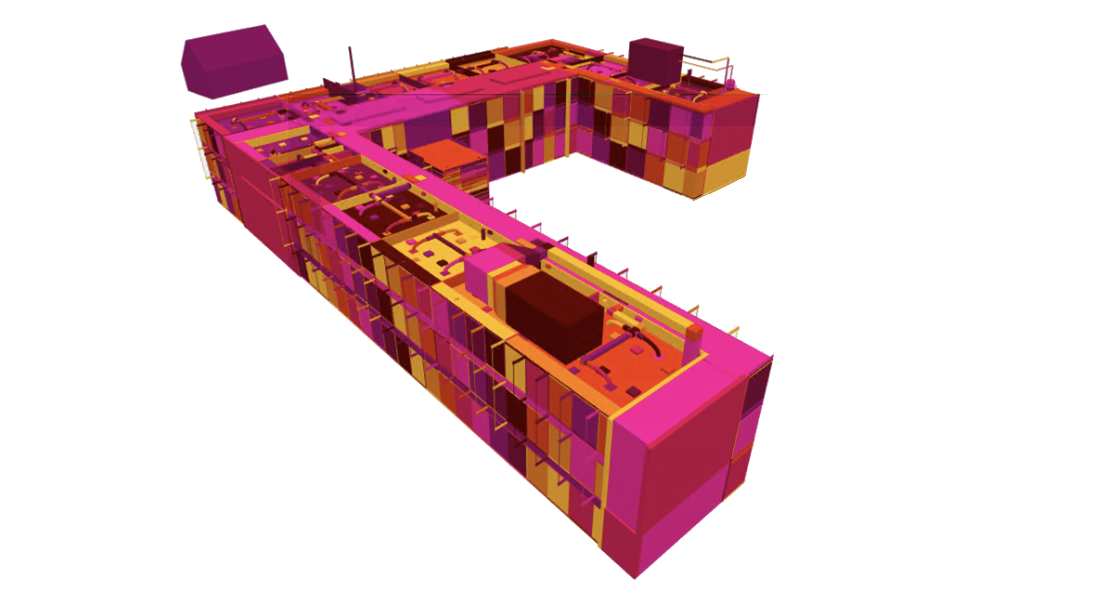
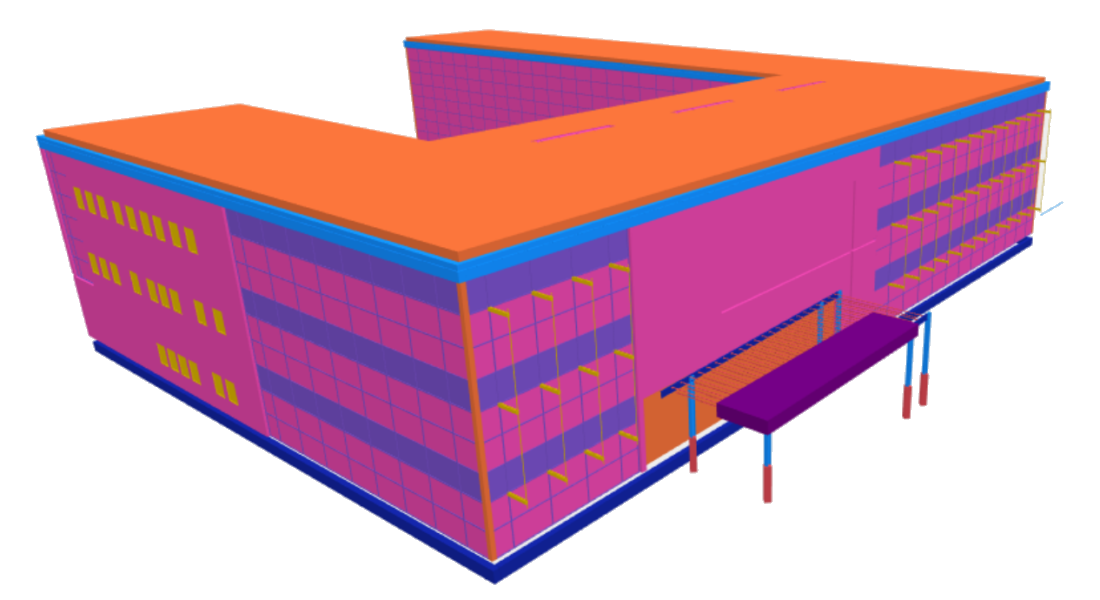
Use Power BI Export for visualizing your Revit data

The interactive dashboard allows you to customize your data representation and emphasize what matters the most
Download a free trial of Kobi Toolkit and check out over 40 tools that are also included in the Kobi Toolkit for Revit.
For additional information reach out to us at support@kobilabs.com
HEAD OFFICE
3910 163rd Ave SW
Tenino, WA 98589
USA
EU OFFICE
Podutiška cesta 92 1000 Ljubljana, Slovenia Europe