# Graph
Command Description
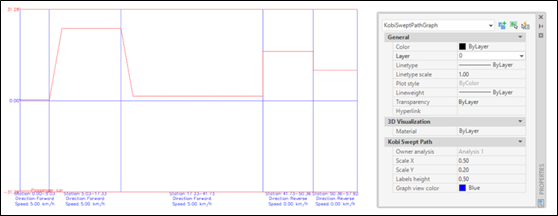
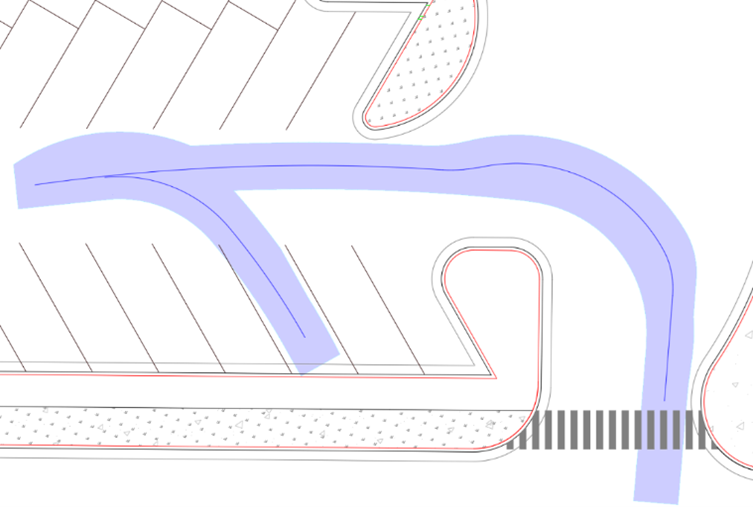
This command draws a wheel steering angle graph for the selected horizontal swept path analysis. The X-axis shows stations, driving speed, and direction (forward or reverse) for each segment. The Y-axis displays the wheel steering angles. The graph is a custom entity called KobiSweptPathGraph. Its X and Y scale factor, label height, and view color can be adjusted in the drawing.
To create a graph
Click Kobi Swept Path > Report Panel > Graph
 .
.Select an existing horizontal swept path analysis in a drawing.
- Pick a graph position.